Best F1 Fantasy Strategy: When Is Budget Worth Points?
Budget growth or points? What the first 17 rounds of 2026 show about F1 Fantasy strategy, with real budget thresholds, transfer lessons and an FAQ.
Hindsight analysis, not a prediction. Everything here was worked out after the races, knowing every real result and price change in rounds 1–17. It shows what was possible, not what anyone could have known beforehand, and none of it is a pre-race forecast. The best paths are the best found by search, not proven global optima.
The short answer. Chase points every race and treat budget as a tool, not a score. In hindsight, the best legal 2026 season found (rounds 1–17) scored 5,933 points while growing the budget to $143.9M; chasing budget alone reached $164.4M but only 3,596 points. Budget pays off in steps: it matters when it carries you across a price threshold that unlocks a stronger team, and is worth nothing in between.
When does budget growth matter in F1 Fantasy?
Hindsight finding
Budget matters at thresholds: the price points where a stronger driver or constructor becomes affordable. Between thresholds, extra budget buys nothing. In 2026 rounds 2–17, an extra $1M bought exactly zero points in 7 of 16 races, but an extra $5M was never worth zero and averaged 9.6 points per race (the full research is further down).
When a threshold does fall inside a $1M window, it can be worth a lot. These are real 2026 steps, each showing the best team a manager could afford just below and just above the threshold:
| Race | Budget step | Points of best team | What changes |
|---|---|---|---|
| 4. Miami GP | $107.4M → $108.4M | 346 → 369 (+23) | Kimi Antonelli, Fernando Alonso out; Lando Norris, Sergio Perez in |
| 7. Spanish GP (Barcelona) | $107.2M → $108.2M | 271 → 284 (+13) | Liam Lawson out; Isack Hadjar in |
| 8. Austrian GP | $108.9M → $109.7M | 254 → 262 (+8) | Lewis Hamilton, Racing Bulls out; Gabriel Bortoleto, Red Bull Racing in |
| 12. Dutch GP | $119.6M → $120.6M | 327 → 344 (+17) | Liam Lawson, Mercedes out; Charles Leclerc, Ferrari in |
The Miami, Spanish and Dutch rows are among the largest $1M steps found inside each race's realistic budget range, picked after the fact to show what a threshold looks like. They are not typical: the average $1M was worth 1.6 points. The Austrian Grand Prix row is the example explained in detail below.
Over a season, budget growth is how a manager reaches those thresholds later. The best legal path grew its budget from $100M to $143.9M (about $2.6M a race), and the points-only path to $137.3M. Planning for budget while still putting points first was worth 125 points over the season. See the season strategy and budget growth analysis for every race, team and transfer.
When is maximizing points better than building budget?
Hindsight finding
- When no threshold is in reach. If the next price step above your budget is more than a couple of million away, small budget gains buy nothing: $0.5M was worth zero in 10 of 16 races and $1M in 7 of 16. Giving up points this week for a small budget gain is usually not repaid.
- When budget costs more points than it earns. The budget-only path ended $20.5M richer than the best legal path and scored 2,337 fewer points. Its teams cost about $78.1M on average against roughly $130.5M available, so most of the extra budget never became a better team. Even a generous straight-line reading of the table below (about 1.9 points per race per $1M) puts that extra budget at roughly 670 points over 17 races, far below the 2,337 given up. That is a rough scale, not a measured result.
- When a transfer would cost more than it gains. Every extra transfer costs 10 points. The points-only path paid for 12 transfers (120 penalty points); the best legal path paid for only 5 (50) and still scored more.
Practical takeaways: F1 Fantasy transfer strategy and team value
Before-race guidance
The hindsight findings above explain what worked in 2026. The points below are general guidance based on the game's rules and those patterns. They are not predictions of which prices will rise or which team will score next, and they do not replace a pre-race projection.
- Treat budget as a means, not a score. The budget-only path built the most team value and the fewest points. Judge every move by the points it gives you this race and the thresholds it brings into reach.
- Spend free transfers before paid ones. A paid transfer costs 10 points, so it should buy clearly more than 10 points. In the best legal path that happened 5 times in 17 races.
- Look at the next threshold, not the next $1M. Before giving up points to gain budget, check what the next price step above your budget would actually buy. The examples above show a single swap worth 8–23 points inside $1M, and long stretches where nothing changes.
- Build team value by holding strong scorers whose prices are rising. The best legal path grew about $2.6M a race this way. Even the budget-only path never gained more than $4.2M in a single race, so a weak team cannot be rescued by one good price week.
- Save Wildcard and Limitless for big restructures. They remove the transfer penalty. In the best legal path the Wildcard in round 2 covered 5 transfers with no penalty, and Limitless in round 4 was worth +220 points against the team held that week.
- Use projections for the race in front of you. This page looks backwards. To plan a transfer or a team for the next race, use the F1 Fantasy optimizer, which fits a squad to your exact budget and transfers, and the race predictions. Their accuracy is published on the model accuracy & results page.
How much is $1M worth in F1 Fantasy? The 2026 research
Hindsight finding
The research in one line. In 2026 rounds 2–17, an extra $1M of budget was worth about 1.6 points per race on average, and an extra $5M about 9.6 points per race. But it comes in steps, not a straight line: in 7 of 16 races an extra $1M bought exactly zero points, and the typical race gained 0–2.
Why it is a staircase
For any one race, there is a best team you can afford at every budget. Raise the budget a little and the best team usually stays the same, because the next-best swap costs more than you have. Then you cross a price threshold, a more expensive driver or constructor becomes affordable, and the score jumps. Plotted against budget, the best score looks like a staircase: long flat treads, then sudden risers. That is why the average value of $1M (1.6 points) hides a lot of races where it was worth nothing and a few where it was worth several points.
A real example: the Austrian Grand Prix
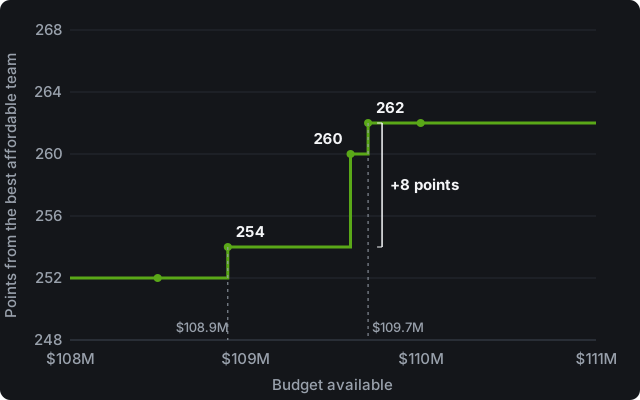
At the Austrian Grand Prix (round 8), the best team a manager with $108.9M could afford scored 254 points. With $109.7M, only $0.8M more, the best affordable team scored 262 points: +8 points for $0.8M. The jump came in two steps, one at $109.6M and one at $109.7M, as set out below. Another $0.8M anywhere else on the staircase might have bought nothing. This example sits below the reference budget used for round 8 in the tables further down ($113.6M); the thresholds sit at different budgets in every race, which is why the averages below pool many races.
| Budget needed | Points | Team (first row) / what changes |
|---|---|---|
| $108.9M | 254 | Max Verstappen, Lewis Hamilton, Fernando Alonso, Arvid Lindblad, Nico Hulkenberg, Mercedes, Racing Bulls |
| $109.6M | 260 | Lewis Hamilton, Fernando Alonso out; Kimi Antonelli, Gabriel Bortoleto in |
| $109.7M | 262 | Kimi Antonelli, Racing Bulls out; Fernando Alonso, Red Bull Racing in |
What extra budget was worth, across 16 races
| Extra budget | Average points per race | Middle half of races | Races worth exactly 0 |
|---|---|---|---|
| $0.5M | 1.1 | 0–2 | 10 of 16 |
| $1M | 1.6 | 0–2 | 7 of 16 |
| $2M | 3.4 | 0–4 | 4 of 16 |
| $3M | 7.1 | 3–7 | 2 of 16 |
| $5M | 9.6 | 5–9 | 0 of 16 |
| $8M | 13.1 | 7–12 | 0 of 16 |
How to read it. “Extra budget” means: take the realistic budget a manager might have held at that point of the season, then ask how many more points the best affordable team scores with that much more. The middle half column is the range covering the middle half of the 16 races. Because the benefit arrives in steps, a $1M gain is a lottery ticket for a threshold, while a $5M gain almost always crosses at least one (it never bought zero in these 16 races).
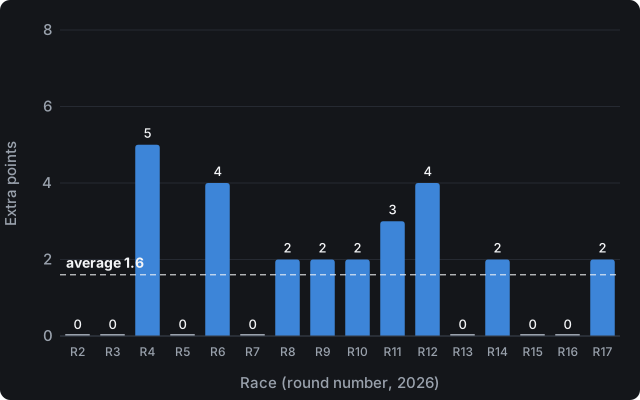
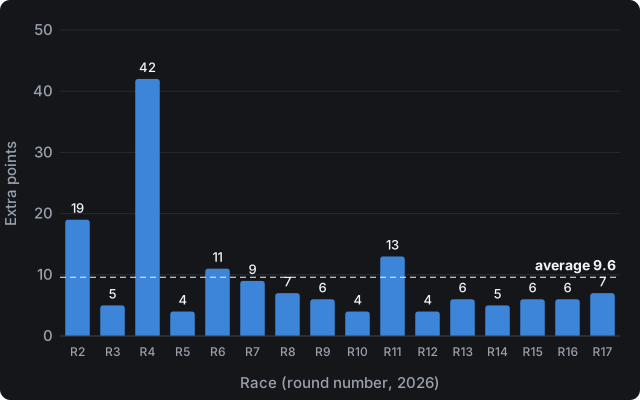
| Race | Reference budget | +$1M | +$5M |
|---|---|---|---|
| 2. Chinese GP | $101.9M | 0 | 19 |
| 3. Japanese GP | $103.9M | 0 | 5 |
| 4. Miami GP | $105.8M | 5 | 42 |
| 5. Canadian GP | $107.8M | 0 | 4 |
| 6. Monaco GP | $109.7M | 4 | 11 |
| 7. Spanish GP (Barcelona) | $111.6M | 0 | 9 |
| 8. Austrian GP | $113.6M | 2 | 7 |
| 9. British GP | $115.5M | 2 | 6 |
| 10. Belgian GP | $117.5M | 2 | 4 |
| 11. Hungarian GP | $119.4M | 3 | 13 |
| 12. Dutch GP | $121.3M | 4 | 4 |
| 13. Italian GP | $123.3M | 0 | 6 |
| 14. Spanish GP | $125.2M | 2 | 5 |
| 15. Azerbaijan GP | $127.2M | 0 | 6 |
| 16. Bahrain GP | $129.1M | 0 | 6 |
| 17. Singapore GP | $131.0M | 2 | 7 |
How much this depends on the starting budget
The $1M answer is sensitive to exactly where in the budget range you start, because a threshold is either just above you or it is not. We use a reference point 60% of the way up the realistic range. Moving it between 30% and 70% changes the average value of $1M between 0.7 and 3.0 points and the number of zero-point races between 6 and 11 of 16. Averaged across those starting points it is 1.7 points, close to the headline figure. The $5M answer is steadier: 8.4–10.3 points, 9.5 on average.
| Starting point in range | +$1M average | +$1M zero races | +$5M average |
|---|---|---|---|
| 30% | 2.4 | 8 of 16 | 9.5 |
| 35% | 0.9 | 10 of 16 | 9.3 |
| 40% | 0.9 | 10 of 16 | 10.3 |
| 45% | 1.8 | 8 of 16 | 10.3 |
| 50% | 0.7 | 11 of 16 | 9.6 |
| 55% | 3.0 | 6 of 16 | 10.1 |
| 60% | 1.6 | 7 of 16 | 9.6 |
| 65% | 1.4 | 10 of 16 | 8.8 |
| 70% | 2.1 | 7 of 16 | 8.4 |
Method and assumptions
- Data. For every race, the exact best team at every budget from what the assets really scored (including the 2× DRS driver), found with the same engine behind the F1 Grid IQ optimizer. Rounds 2–17: round 1 is excluded because every manager starts with exactly $100M, so there is no range of budgets to compare.
- Reference budget. The realistic budget range grows with the season: from $100M plus $0.8M per completed race at the low end to $100M plus $2.7M per race at the high end (our estimates of the range managers actually hold). The reference point is 60% of the way up that range for each race; in round 17 that is $131.0M.
- Single race, no transfer limits. Each comparison asks what the best team is for one race at a given budget. It ignores transfer limits, penalties and chips, so a real manager could not always make every swap. Treat the numbers as the budget's value for the team you could build, not as points guaranteed from a transfer.
- Hypothetical budget. The extra $1M or $5M is simply assumed. Earning it costs something (see best season strategy & budget growth, where the budget-only path gave up 2,337 points).
- Not additive. Per-race values should not be added up into a season total; budget compounds and the best teams change from race to race.
What this does not show
- It is hindsight. It uses the real points each team scored. A manager choosing before the race does not know them, so this is not a forecast of what extra budget will buy next week.
- It is 16 races of one season. The averages carry real spread (middle half 0–2 points for $1M), and a different season could look different.
- It is not proof of a global optimum for any manager's season; it is a measurement of one budget-versus-points trade-off in one season's data.
For the season-long view, including how budget and points trade off over 17 races, see F1 Fantasy 2026: best season strategy & budget growth. To see how F1 Grid IQ's own projections have performed, see model accuracy & results.
F1 Fantasy strategy FAQ
What is the best F1 Fantasy strategy for 2026?
Looking back at rounds 1–17, points first with budget as a tool worked best: the best legal season found scored 5,933 points, the same approach with no plan for budget 5,808, and chasing budget alone only 3,596. That is hindsight, not a forecast. For the next race, start from the optimizer and the predictions.
What is a good F1 Fantasy budget strategy?
Aim to cross price thresholds, not to hoard cash. An extra $1M was worth nothing in 7 of 16 races, while $5M never was (9.6 points on average). Budget that is never turned into a stronger team is wasted; the budget-only path held far more than its teams cost.
How do I increase my F1 Fantasy team value?
Team value moves with the price changes of the assets you hold. The best legal path grew from $100M to $143.9M (about $2.6M a race) while keeping its teams strong. Chasing value alone reached $164.4M but cost 2,337 points, so value is best grown as a by-product of good teams.
What is the best F1 Fantasy transfer strategy?
Use free transfers first and pay the 10-point penalty only for a swap that gains clearly more than that. The best legal path paid for 5 transfers in 17 races, the points-only path for 12. Wildcard and Limitless remove the penalty, so they suit big restructures. The optimizer weighs transfer cost for you.
F1 Fantasy budget vs points: which matters more?
Points. Budget matters when it unlocks a stronger team, and the effect comes in steps. Planning for budget while putting points first added 125 points over the season against ignoring it, but chasing budget on its own lost 2,337. The season analysis shows all three paths.
Can I use this analysis to predict the next race?
No. It is hindsight analysis of 2026 rounds 1–17 using real results and prices, so it cannot say which team will score or which prices will rise. For pre-race projections use the predictions; their track record is on the model accuracy & results page.
Use the same engine on the race in front of you.
F1 Fantasy optimizer →Hindsight analysis of the 2026 F1 Fantasy season, rounds 1–17 (through the Singapore Grand Prix), published 2026-10-14. F1 Grid IQ is independent and is not affiliated with Formula 1, the FIA or the official F1 Fantasy game. Points and prices come from the official F1 Fantasy data feed.